
Mathematics classroom notes
Year 3 - Describe probabilities — impossible to certain
Strand / topic: Statistics and Probability / Describe probabilities — impossible to certain
Based on Pi Leo Academy's Victorian Curriculum F-10 Mathematics year-level guide and aligned to NAPLAN-style mathematical reasoning. Official curriculum code: Not stated in the provided curriculum source.
By the end of this note, students should be able to explain describe probabilities — impossible to certain, use a clear method, solve simple and test-style questions, and check their answers for Year 3 Statistics and Probability work.
It helps students read graphs in school, news, sport, weather and online information. This is a NAPLAN year, so students should practise reading the question carefully, choosing the correct operation or formula, showing working and checking whether the answer is reasonable.
What does the information show?
Data is easier to understand when it is organised in a table or graph.
A bar graph can quickly show which sport is most popular.
For Year 3, focus on understanding the idea before rushing to the final answer.
Think about it: class surveys, weather charts and sport results all use data.
Use this visual to organise describe probabilities — impossible to certain before calculating.
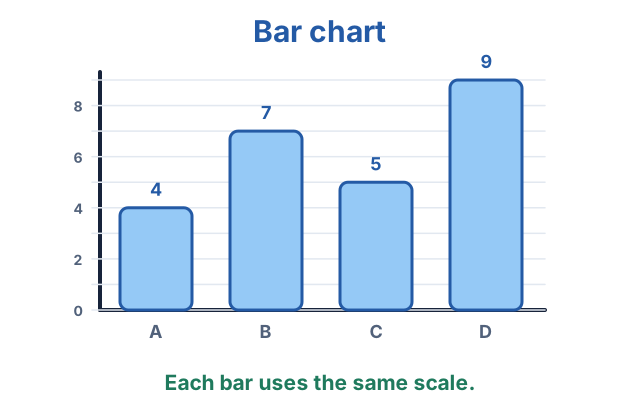
Read the scale before comparing bars.
What you need to know for this topic
Use this as a study checklist before trying quizzes, worksheets or NAPLAN-style questions.
Collecting data
- choose a useful question
- collect tally or table data
- sort categories
- record results clearly
Displays
- read tables
- picture graphs
- column and bar graphs
- line graphs
- frequency tables
Interpreting
- compare categories
- choose a suitable graph
- read the scale
- answer using evidence from the data
1 What this means
Data is information we collect, sort, show and read. Start by learning to read the title, labels, scale and units before drawing a conclusion. A helpful visual is a correctly labelled table, plot or graph. For example, this idea can be used when interpreting a survey, sport result or weather display.
Data questions ask students to read information carefully before making a calculation or conclusion. In Year 3, students should first ask, 'What is the question really asking me to find?' Then they can draw a picture, make a table, use a number line, write a formula or build an equation. The final answer should match the story, the units and the size of the numbers.
- Read the title, labels, key and scale before answering.
- Compare categories carefully instead of guessing from bar height alone.
- When calculating summaries, organise values first.
- Answer with a sentence that refers to the data.
2 Important rules / ideas
Check title, labels, key and scale first.
Use subtraction for 'how many more' questions.
Mean, median, mode and range each describe data in a different way.
Important vocabulary
Information collected to answer a question.
A group used to organise data.
A fair-share average.
The middle value when data is ordered.
3 Step-by-step method
- Read the title, labels and scale.
- Find the category or values needed.
- Calculate carefully if a summary is required.
- Answer in a sentence connected to the data.
4 Worked examples
Find the mode of 2, 3, 3, 5, 6.
- The mode is the value that appears most often.
- 3 appears twice.
- Mode = 3.
Find the median of 4, 9, 2, 7, 8.
- Order the data: 2, 4, 7, 8, 9.
- The middle value is 7.
- Median = 7.
Find the mean of 6, 8, 10, 12.
- Add values: 6 + 8 + 10 + 12 = 36.
- There are 4 values.
- 36 / 4 = 9. Mean = 9.
A graph shows 12 students chose soccer and 8 chose netball. How many more chose soccer?
- Compare the two categories.
- 12 - 8 = 4.
- 4 more students chose soccer.
5 More examples
A graph shows 18 dogs and 11 cats.
18 - 11 = 7 more dogs.
Find the mean of 4, 5, 9.
Total is 18 and there are 3 values, so mean = 6.
NAPLAN-style thinking
In NAPLAN-style questions, describe probabilities — impossible to certain may appear as a short calculation, a word problem, a diagram, a table or a multi-step reasoning question. Students should slow down and decide what the question is really asking before calculating.
Estimate first and eliminate answers that are too small, too large or use the wrong unit.
Write only the answer required, but use working on paper to avoid mental slips.
Circle the numbers, underline the action words and decide whether all numbers are needed.
Do one step at a time and label intermediate answers so the final step is clear.
6 Common mistakes
Read the final sentence before calculating.
Name the topic and method before starting.
Estimate or use inverse operations to check.
- Choosing the first operation seen in the wording.
- Forgetting units, labels or place value.
- Stopping after the first step when the question asks for a final comparison.
7 Tips to remember
A bar that looks twice as tall is not always twice the value if the scale changes.
Answers should refer to numbers in the display.
Choose mean, median, mode or range based on what the question asks.
Parent teaching tips
- Ask your child to explain the method aloud before writing the answer.
- Use a real-life context at home, such as shopping, cooking, sport scores, maps or timetables.
- Praise clear working and checking, not only speed.
- Encourage a quick diagram or table for word problems before calculating.
Remember
For describe probabilities — impossible to certain, identify the question type, choose a clear method, show working and check the answer.
8 Quick practice
- Find the mode of 2, 3, 3, 5, 6.
- Find the median of 4, 9, 2, 7, 8.
- Find the mean of 6, 8, 10, 12.
- A graph shows 12 students chose soccer and 8 chose netball. How many more chose soccer?
9 Answers / explanation
Question 1
Answer: Mode = 3.
The mode is the value that appears most often. 3 appears twice. Mode = 3.
Question 2
Answer: Median = 7.
Order the data: 2, 4, 7, 8, 9. The middle value is 7. Median = 7.
Question 3
Answer: 36 / 4 = 9. Mean = 9.
Add values: 6 + 8 + 10 + 12 = 36. There are 4 values. 36 / 4 = 9. Mean = 9.
Question 4
Answer: 4 more students chose soccer.
Compare the two categories. 12 - 8 = 4. 4 more students chose soccer.
Extension challenge
Collect a small set of data or list a sample space, then write two questions someone could answer from it.
Hint: Use class preferences, sport scores, weather or family survey data.
Answer guide
Answers will vary. A strong answer includes clear working, correct units and a final sentence.
Quick revision
- Know what describe probabilities — impossible to certain is asking you to find.
- Choose a diagram, table, formula, number line or equation before calculating.
- Show enough working that you can find and fix mistakes.
- Check the final answer, units and reasonableness.