
Grouped data and frequency distributions
A clear starting point, worked steps and space to practise.
Start here
Grouped data combines values into intervals. Frequency tells how many values fall in each group.
State which endpoint belongs to which interval. Overlapping boundaries can count a value twice.
1 Work through these steps
- Read each interval boundary carefully.
- Assign each value to exactly one group.
- Record the frequencies.
- Check that frequencies add to the total number of observations.
2 Follow a worked example
Data are 2, 4, 7, 11, 14. Count values in 0 ≤ x < 5, 5 ≤ x < 10 and 10 ≤ x < 15.
- 2 and 4 are in the first interval: 2.
- 7 is in the second: 1.
- 11 and 14 are in the third: 2.
- Frequencies 2, 1, 2 total 5.
3 Try it yourself
Show each step on paper or open Working out. Then check the answer.
-
Which interval contains 10: 5 ≤ x < 10 or 10 ≤ x < 15?
Check answer 1
Answer: 10 ≤ x < 15
The first interval excludes 10; the second includes it.
Scratchpad · Not saved
Working out
Draw with a finger, pen or mouse, or type your working below.
Your working stays on this page. It is not submitted or saved, and clears when you leave or reload.
Check your understanding
Explain the worked example in your own words. Say why the method works, not just what the answer is.
Skills and explanation links
Key ideas taught here
- Grouped data combines values into intervals. Frequency tells how many values fall in each group.
- State which endpoint belongs to which interval. Overlapping boundaries can count a value twice.
Method and checking
Optional recap: related Maths skills
These earlier examples revisit background skills. Start with the topic example and practice above.
Useful vocabulary
- data
- Information collected to answer a question.
- category
- A group used to organise data.
- mean
- A fair-share average.
- median
- The middle value when data is ordered.
Rules for these related skills
Check title, labels, key and scale first.
Use subtraction for 'how many more' questions.
Mean, median, mode and range each describe data in a different way.
Find the mode of 2, 3, 3, 5, 6.
- The mode is the value that appears most often.
- 3 appears twice.
- Mode = 3.
Find the median of 4, 9, 2, 7, 8.
- Order the data: 2, 4, 7, 8, 9.
- The middle value is 7.
- Median = 7.
Find the mean of 6, 8, 10, 12.
- Add values: 6 + 8 + 10 + 12 = 36.
- There are 4 values.
- 36 / 4 = 9. Mean = 9.
A graph shows 12 students chose soccer and 8 chose netball. How many more chose soccer?
- Compare the two categories.
- 12 - 8 = 4.
- 4 more students chose soccer.
More visual models and everyday examples
Each everyday example has its own information and model. Use its stated values rather than copying values from another question.
Concept example. The story examples below have their own diagrams.
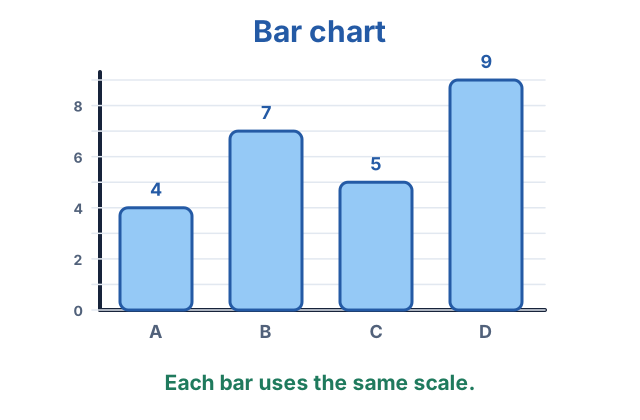
Read the scale before comparing bars.
For parents and teachers
- Ask your child to explain the method aloud before writing the answer.
- Use a real-life context at home, such as shopping, cooking, sport scores, maps or timetables.
- Praise clear working and checking, not only speed.
- Ask your child to write the formula or rule first, then substitute values carefully.
Practise choosing a method from the information in the question. The examples here are Pi Leo Academy learning activities. Official NAPLAN testing takes place in Years 3, 5, 7 and 9; a topic appearing in these notes does not mean it is tested in NAPLAN.
These notes provide guided examples and practice; they do not certify completion of every curriculum requirement.